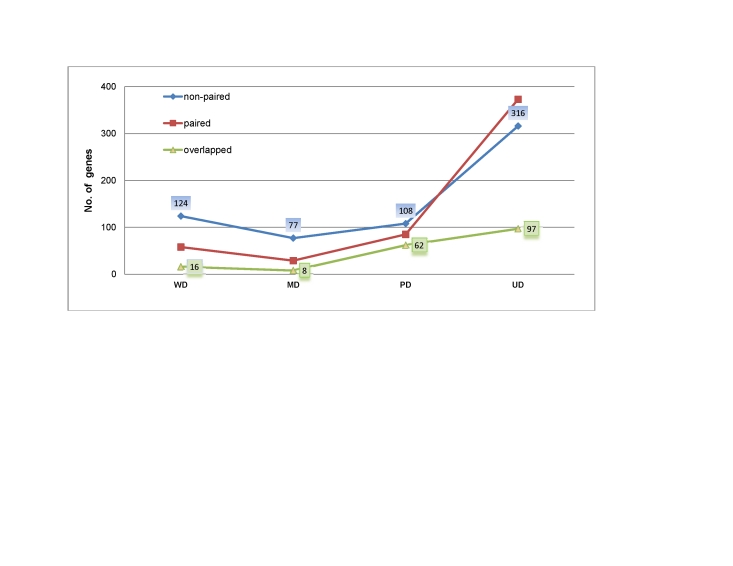
Figure 1. Relationship between cancer grades and the number of differentially expressed genes, with fold-change (FC) > = 2 and P-value <0.05 by Wilcoxon signed–rank test (blue), using paired sample information, and fold-change test defined in this study (red), without using paired-sample information.
The green plot shows the overlapped identification between these two strategies.

