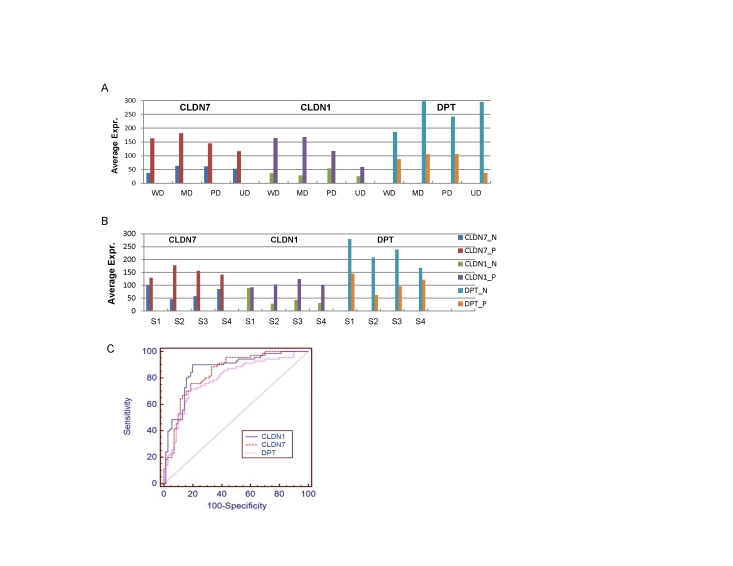
Figure 5. Average expression of three genes (CLDN7, CLDN1 and DPT) in cancer and normal samples, respectively.
(A) for each subtype (WD, MD, PD, UD); (B) for each stage (stage I, II, III and IV); and (C) the ROC curve shows the discerning power of each gene for classification of cancer versus normal samples (AUCs of CLDN1, CLDN6 and DPT are 0.86, 0.84 and 0.79, respectively, with a significance level of P = 0.0001).

