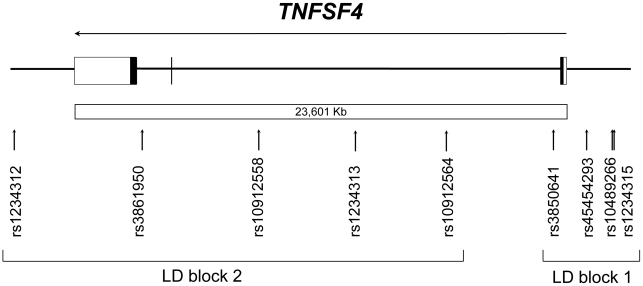
Figure 1. The TNFSF4 gene as represented in the NCBI database.
Vertical arrows denote SNPs tested in human subjects. Horizontal arrow indicates direction of transcription. Exons are depicted by boxes: filled-in regions indicate translated portions of the gene and untranslated regions are depicted by open boxes; introns are indicated as solid lines between boxes. LD: Linkage disequlibrium.

