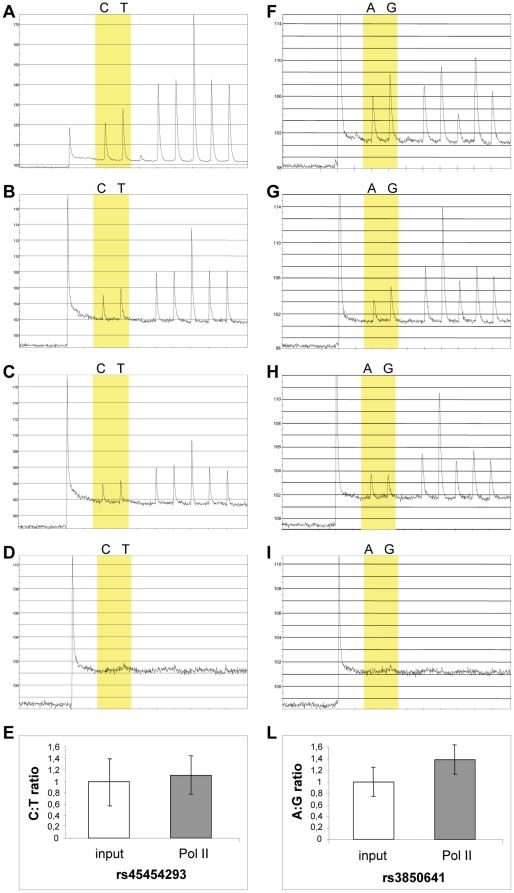
Figure 2. Allele-specific loading of phosphorylated Pol II in vivo at rs45454293 (A-D) and rs3850641 (F-I) sites.
To quantify the relative levels of abundance of allele-specific fragments, pyrosequencing was used to analyze input chromatin used in ChIP reactions (A, F); products of ChIP using specific antibodies to total Pol II as positive control (B, G); to phosphorylated serine residues of Pol II CTD (C, H); or to SV40 T antigen as mock antibody control (D, I). Graphs show input nucleotide sequence along the x axis and intensity of signal along the y axis. (E/L) The ratios between the C and T alleles of SNP rs45454293 (E) and the A and G alleles of SNP rs3850641 (L) of phosphorylated Pol II loading compared with input chromatin used in ChIP reactions are shown. Data are expressed as mean (95% c.i.) of two independent immunoprecipitation reactions, with each immunoprecipitation analyzed by PCR in up to three replicates.

