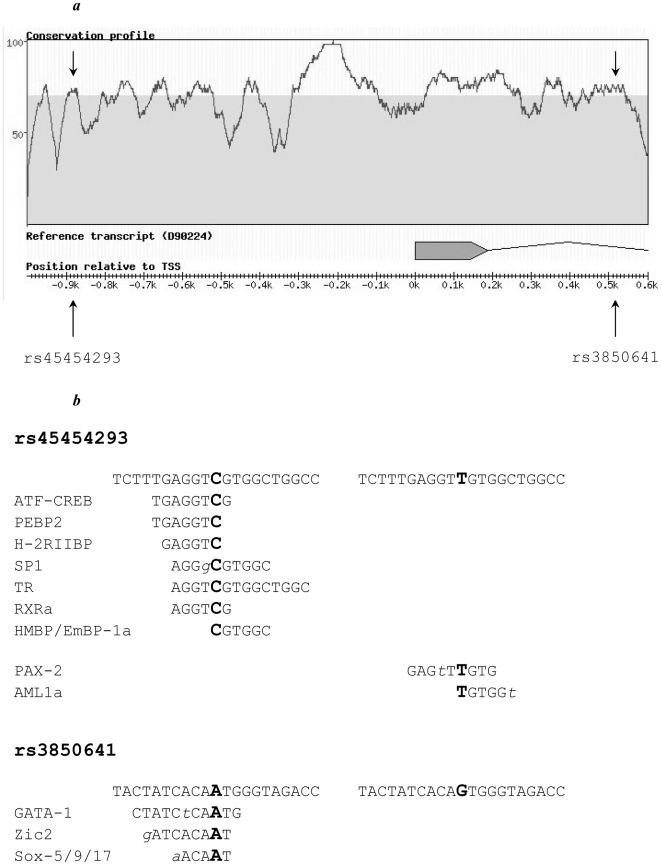
Figure 4. (A) TNFSF4 region across the transcription start site.
Conservation profile between human and mouse obtained using the RAVEN software. Area above the gray area indicates a degree of homology >70%; arrows represent tested SNPs. The TNFSF4 gene was retrieved from the NCBI database (GenBank accession number D90224). (B) Sequence of the TNFSF4 promoter between positions –931 and –911 (upper) and of intron 1 between positions +474 and +494 (lower), indicating the polymorphic sites. Potential binding sites for different transcription factors are indicated for both alleles. Allelic variants for each polymorphism are indicated in bold, mismatches between TNFSF4 sequence and transcription factor binding sites are indicated in lower case italic.

