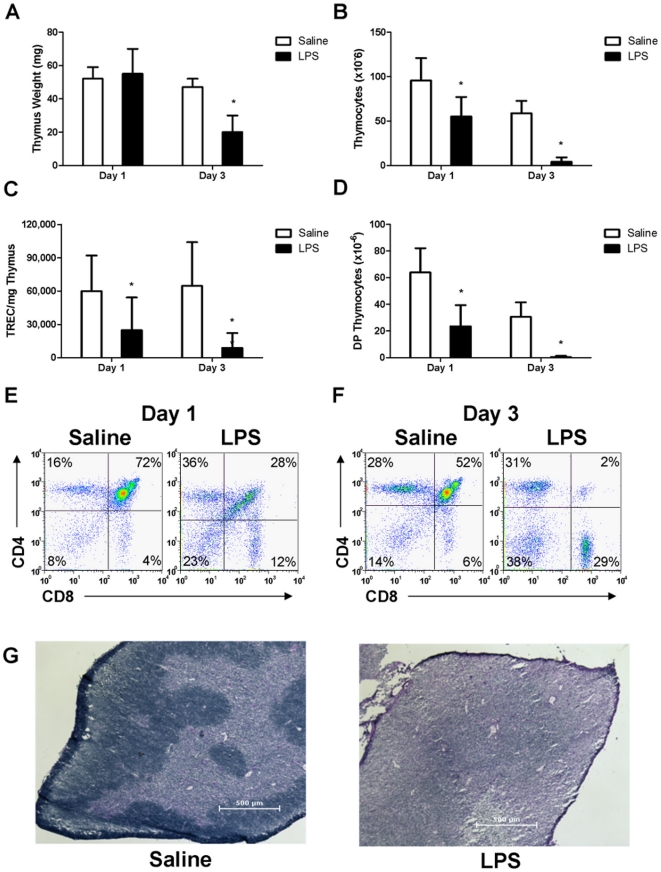
Figure 1. Endotoxin-induced acute thymic atrophy.
Female mice were administered either saline or E. coli LPS. (A) Thymus weight, (B) Total number of thymocytes, (C) mTREC/mg thymus, (D) Absolute number of DP thymocytes. Representative flow cytometry plots of thymocyte phenotype were determined at (E) one and (F) three days post treatment. (G) Representative hematoxylin and eosin staining of thymus tissue four days post LPS challenge. *p<0.05 compared to saline-treated controls (n = 5).

