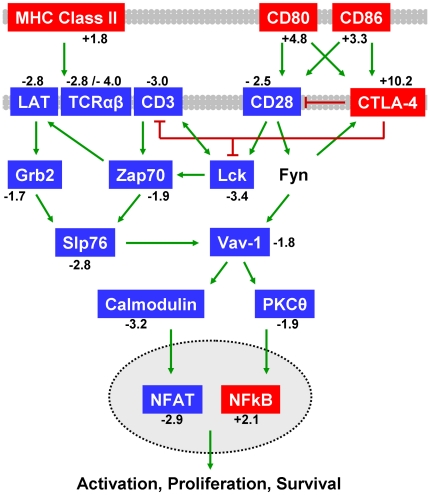
Figure 5. Decreased CD28 signaling and activated CTLA-4 pathways during acute thymic atrophy.
The CD28 pathway ranked fifth in significance and fourth by differential expression (p-value = 1.07×10⁻¹⁰) using Metacore pathway analysis. Pathway analysis also determined the CTLA-4 pathway to be differentially affected (p-value = 1.18×10⁻⁸). CTLA-4, CD86 and CD80 mRNA levels were significantly increased while CD28 and TCR signaling-related mRNA levels were decreased. Red genes represent significant increases in mRNA levels and blue genes represent significant decreases in mRNA levels in thymus tissue following LPS treatment. Mean fold changes are given. Green arrows indicate positive influence and red T-bars indicate negative influence. Arrows may represent multiple steps. Plasma membranes are shown in gray. Nuclear membrane is shown as dotted line. A detailed version of the original Metacore pathways are in Figures S7 and S8. A full legend of all GeneGo pathway map symbols is in Figure S9 or at http://www.genego.com/pdf/MC_legend.pdf.

