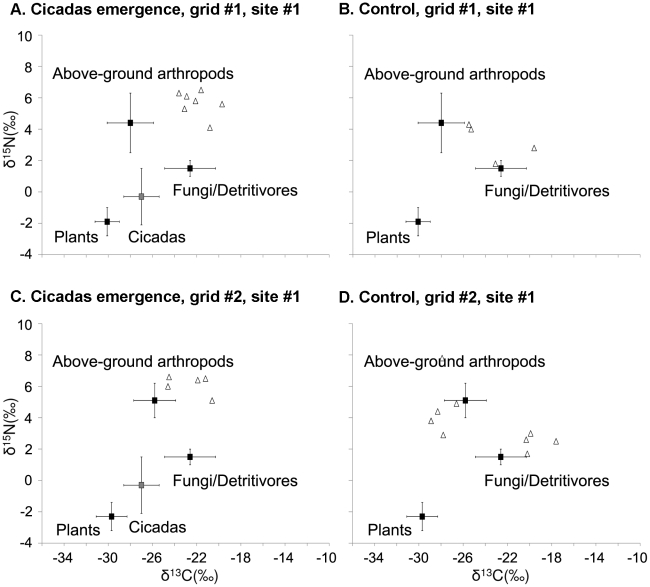
Figure 2. The isotope values of the dietary sources and mice in the cicadas emergence experiment.
The squares (means) and whiskers (s.d.) denote grid-specific isotope values of the dietary sources with the exception of the fungus-detritivore group, for which generic values were used. The triangles denote the isotope values of individual mice. The variability of source isotope values was incorporated into the Bayesian model using s.d. Because the model also incorporates the variability associated with discrimination factors, the values for the mice plotted here were not pre-adjusted for trophic enrichment. Note that grid #1 and grid #2 were both repeatedly sampled in 2003 (used as controls) and 2004 (used as cicadas treatments). Therefore, the isotope values of the dietary sources were the same between A and B (grid #1), and between C and D (grid #2).

