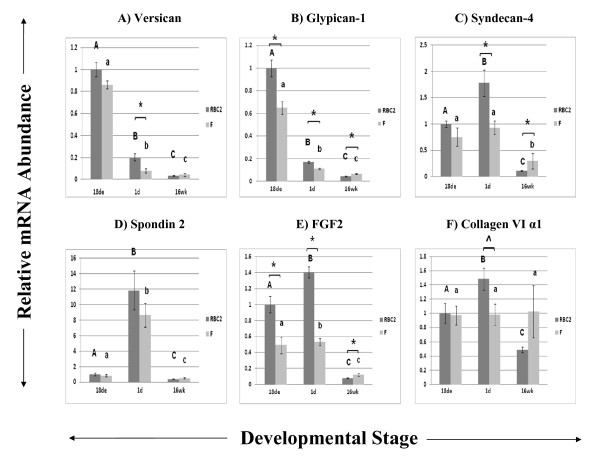
Figure 1.
Relative expression as determined by quantitative real-time RT-PCR of genes related to extracellular matrix (ECM) function. Different letters (uppercase) represent differences between developmental stages for the RBC2 line; different letters (lowercase) represent differences between developmental stages for the F line (P ≤ 0.05). * represents differences between the two genetic lines, RBC2 and F (P ≤ 0.05); ^ represents differences between the two lines (0.05 < P < 0.10).

