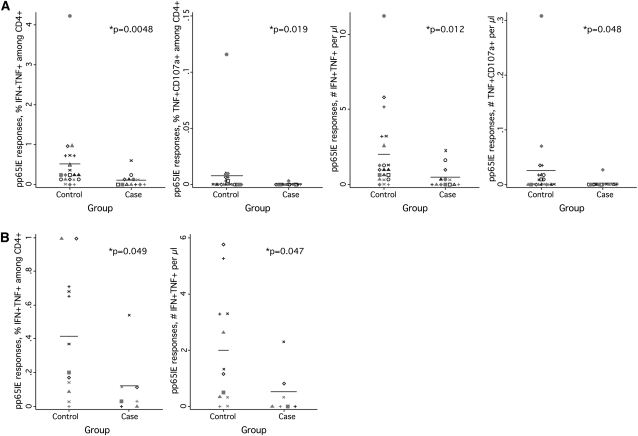
Figure 2.
Cytomegalovirus (CMV)–specific T cell responses in patients and control subjects not exposed to cidofovir. A, Dotplots for patients who either did not receive cidofovir or were not known to have received it (n = 13) and their respective control subjects. From left to right, the dotplots show the fraction of cells making IFN-γ and TNF-α, the fraction making TNF-α and mobilizing CD107a, the number making IFN-γ and TNF-α, and the number making TNF-α and mobilizing CD107a. B, Dotplots for patients known not to have received cidofovir (n = 7). The left plot shows the fraction of cells making IFN-γ and TNF-α; the right plot shows the absolute number of such cells.

