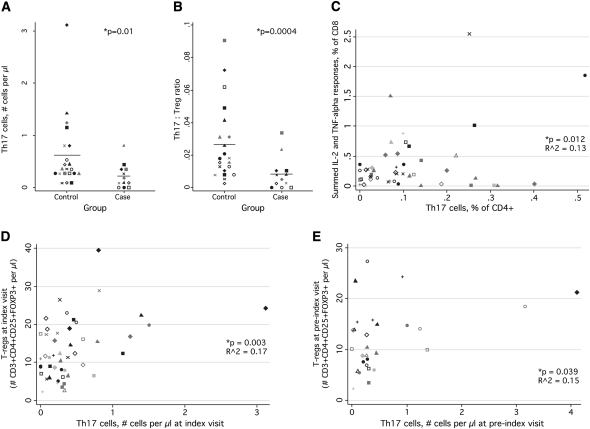
Figure 5.
Relationship of Th17 cells to cytomegalovirus (CMV) immune recovery uveitis (IRU) disease, CMV-specific T cells, and regulatory T (Treg) cells . A, The number of Th17 cells detected in patients and control subjects at the index visit. Symbols and statistics are as described for Figure 1. B, Dotplot showing the Th17:Treg ratio in patients and control subjects at the index visit. The ratio was calculated by dividing the fraction of Th17 cells among CD4+ T cells by the fraction of Treg cells (CD3+CD4+CD25+CD127low) among CD4+ T cells. C, Relationship between Th17 cells, shown on the X axis, and CMV-specific responses among CD8+ T cells, shown on the Y axis. The measure shown is a sum of the fraction of cells found to produce IL-2 alone, TNF-α alone, both cytokines combined, or both cytokines in combination with IFN-γ. D, Relationship between Th17 cells and Treg cells at the index visit. E, Relationship between Th17 cells and Treg cells at the pre-index visit.

