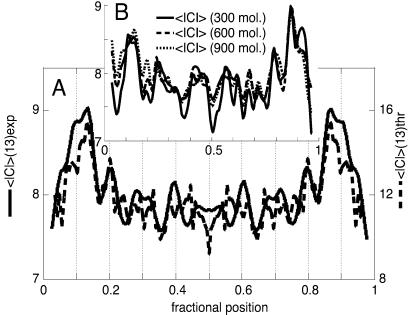
Figure 2.
(A) Plot of the symmetrized experimental average curvature modulus along the chain of ds-DNA palindromic dimers evaluated for chain segments of 13 bp, which is the spatial resolution of the SFM analysis (solid trace, in degrees). A population of approximately 1,000 molecules has been used for curvature evaluations throughout this paper. The theoretical curvature modulus predicted for a DNA molecule of this sequence on the basis of Eq. 3 is superimposed for comparison (dashed trace; see Experimental Methods for details). The difference in the magnitudes of the peaks between the experimental and the theoretical profiles could be caused by the difference in dimensionality between the two-dimensional (2D) experimental and the three-dimensional (3D) theoretical curvature data. (B) Plots of the still-unsymmetrized average curvature modulus profiles obtained from subpopulations of the collected dimer shapes after increasing the entity of the subsets. The solid trace is for a set of 300 molecules, the dashed trace for 600, and the dotted trace for 900. The symmetry of the unsymmetrized averages is evident and proves the completeness of the sets. The entire set of molecules has been used for the curvature calculations throughout the paper.

