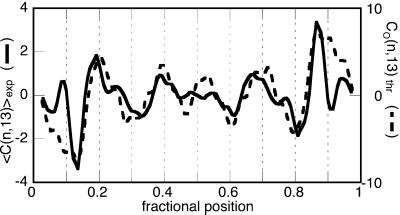
Figure 3.
Plot of the averaged experimental signed curvature for the population of DNA dimers evaluated for 13-bp-long chain segments (solid trace, in degrees) superimposed with the trace of the curvature computed for a model molecule, the 3D structure of which has been flattened to an S-like shape (dashed trace). The base-pair resolution theoretical curvature has been smoothed to facilitate the comparison with the experimental trace.

