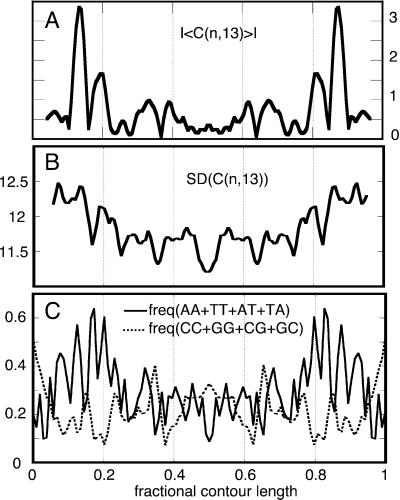
Figure 4.
(A) Plot of the absolute value of the averaged signed experimental curvature (|〈C(n,13)〉|) that highlights the highly curved regions of the chain. (B) Plot of the experimental average SD of the molecular curvature along the chain evaluated for 13-bp-long chain segments [SD (C(n,13), in degrees]. (C) Plot of the profiles of the local frequency of AA, TT, AT, and TA dinucleotide steps along the chain (solid trace) showing correlation with the experimental chain flexibility and a plot of the frequency of CC, GG, CG, and GC steps (dashed trace) showing noncorrelation with the experimental chain flexibility. The traces have been smoothed to facilitate the visualization of the profiles.

