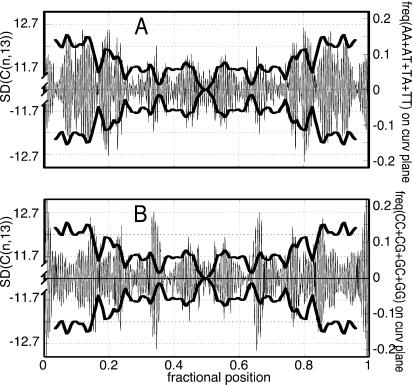
Figure 5.
(A) Pictorial drawing of the curvature-SD profiles (thick trace, in degrees) compared with the frequency of AT-rich sequences, the roll directions of which are projected on the local curvature plane where the fluctuations occur (thin trace). Because positive- and negative-curvature deviations are possible, the experimental SD is reported in both directions. The maxima of the oriented localization of AT-rich steps coincide well with the peaks of the experimental curvature fluctuation. (B) The maxima of the GC-rich steps do not coincide as well with the peaks of the experimental curvature fluctuation as those of the AT-rich steps.

