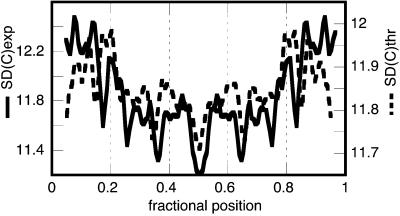
Figure 6.
Comparison between the experimental curvature SD (solid trace, in degrees) with that of the theoretical one (dashed trace). The theoretical SD was computed modulating the above-mentioned experimental average normalized persistence length b(n) (see Experimental Methods) by multiplying it by the local 〈T/T*〉 value averaged over five DNA turns.

