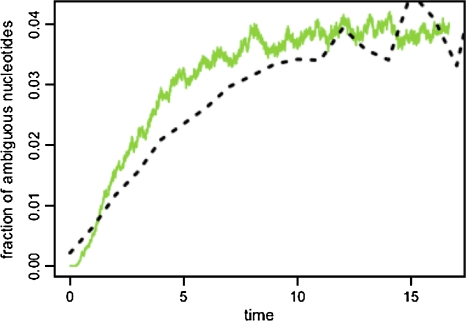
Figure 2.
Temporal increase of the fraction of ambiguous nucleotides in the Wright-Fisher model (WFM) for a population size of 500 and a mutation rate of 3 × 10⁻⁵ mutations per generation (solid green line) and at 4-fold degenerate third-codon positions in the full data set (dashed black line). The curve for the WFM has been obtained by averaging over 104 runs of the model. N and m denote the effective population size and the mutation rate, respectively. The WFM describes discrete and nonoverlapping generations in a population with fixed size N. Every generation, each of the N genomes undergoes mutation with probability m. Then the N genomes for the next generation are determined from the gene pool by drawing every offspring genome with uniform probability from the N parental genomes. Note that the WFM assumes selective neutrality.

