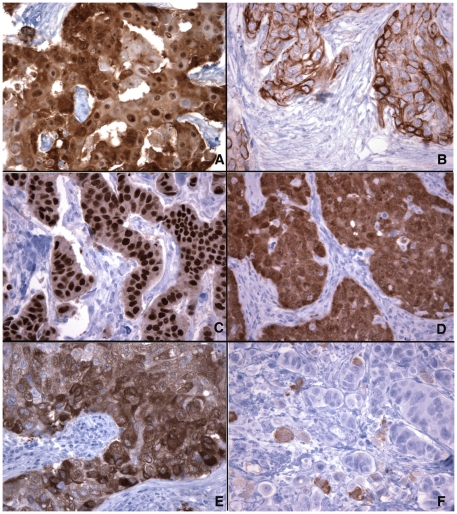
Figure 2. Variations in cellular and subcellular distributions of CT antigens in breast cancer.
(A, B): NY-ESO-1 staining of two ER-negative carcinomas, showing mixed nuclear and cytoplasmic staining in (A) and pure cytoplasmic staining in (B). (C, D): MAGEA staining of two ER-negative carcinomas, showing predominantly nuclear (C) and cytoplasmic (D) staining, respectively. (E, F): CT7 staining in two cases, showing diffuse positivity in >90% of tumor cells in (E), as compared to (F) which showed only scattered positive cells and many tumor cells were negative. (Magnifications: 400X).

