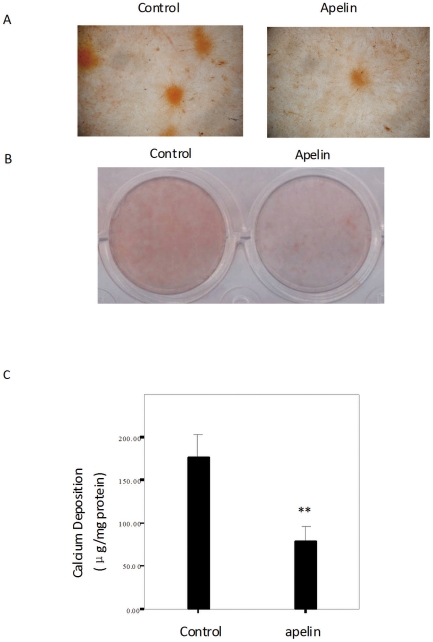
Figure 3. The effects of apelin on the mineralization of the matrix in cultured CVSMCs.
(A) A representative microscopic view of the Alizarin Red S staining at a magnification of 400× for control cells and cells treated with 1 nM apelin in cultures of 12 d duration. (B) A representative entire plate view of the Alizarin Red S staining in 24-well plates for control cells and cells treated with apelin in 12 d cultures. (C) Quantification of the calcium content of the cell layers as measured by the atomic absorption spectroscopy method and normalized to the cellular protein content. The bars represent the mean ± SD (n = 3; **P<0.01 vs. control).

