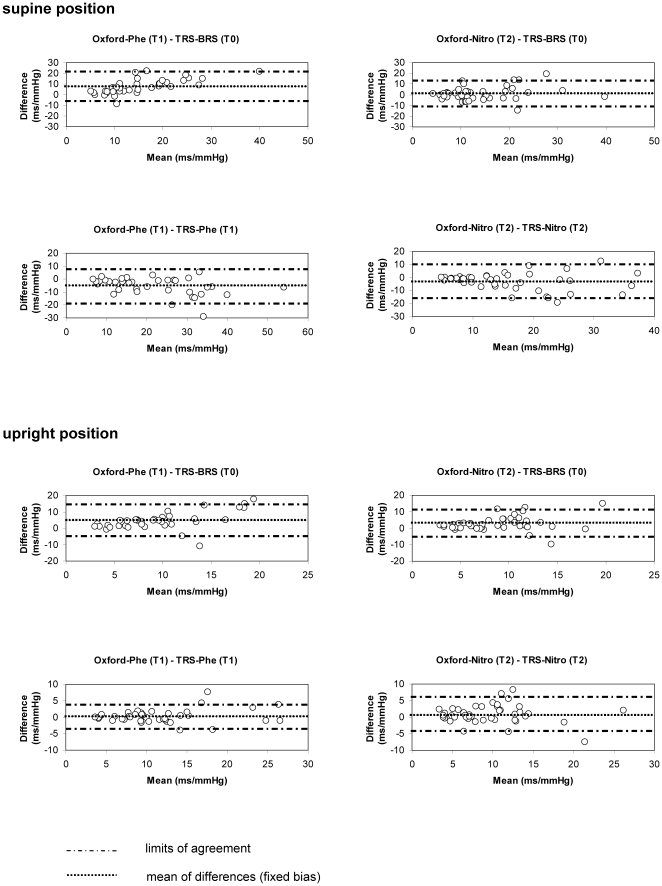
Figure 4. Bland-Altman Plots for comparison of BRS estimates obtained from the modified Oxford method and trigonometric regressive spectral analysis (TRS).
TRS-BRS, BRS determined by TRS during resting conditions; TRS-Phe, TRS-Nitro, BRS determined by TRS during application of phenylephrine (Phe) or nitroprusside (Nitro); Oxford-Phe, Oxford-Nitro, BRS determined by the modified Oxford maneuver using phenylephrine (Phe) or nitroprusside (Nitro).

