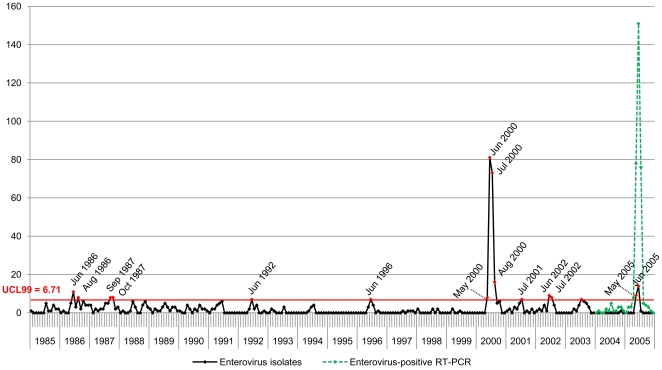
Figure 1. Monthly distribution of Enterovirus isolates (1985–2005), and Enterovirus-positive RT-PCR diagnostic cases (2004–2005).
We identified 9 years of significantly high HEV isolation frequency during which the number of monthly isolates exceeded the upper control limit at 99% confidence level (UCL99 = 6.71, p<0.01). Peak isolation levels were mostly between May and August, except in 1987 in September and October. 2 epidemics were also recorded in 2000 and 2005.

