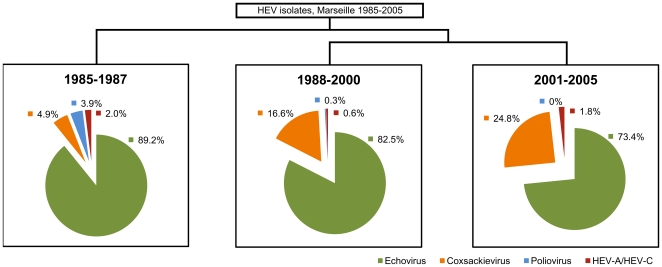
Figure 3. Classification by year of isolation.
The Classification and Regression Tree (CART) split the data by year of isolation, describing 3 temporal periods: 1985–1987, 1988–2000 and 2001–2005. The change in proportion was observed for each virus group, with HEV-B further divided into Echoviruses and Coxsackieviruses, while Poliovirus was regarded as separate from HEV-C.

