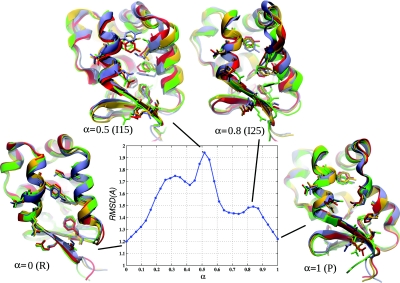
Figure 10.
The curve corresponds to the RMSD computed between the structures in each cell Bn and the initial structure in each cell for simulation F3. The structures correspond to instantaneous MD configurations from simulation F2 in Table 4 constrained to cells B0, B15, B25, and B31.

