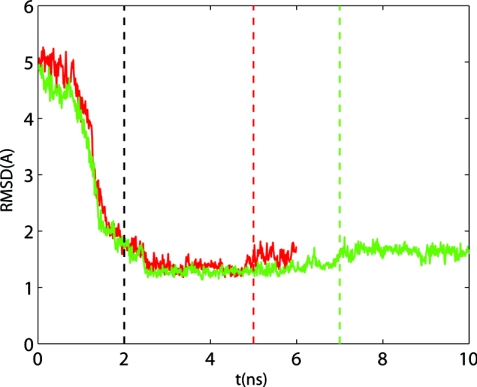
Figure 2.
Evolution of the RMSD of the heavy atoms between the RTMD simulation 5 structures and the corresponding target structures. Red solid line R structure (PPS target); green solid line PPS structure (R target); dashed vertical lines mark the times at which δ reaches 0.0 (black dashed line), the RTMD forces are switched off for the R→PPS simulation (red dashed line) and the PPS→R simulation (green dashed line).

