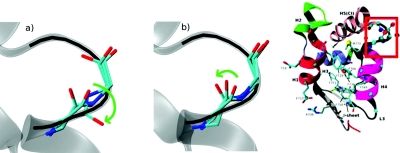
Figure 3.
Conformational change in L4 in zero-temperature path MEP1 (a) and MEP2 (b). The converter in the R conformation is shown in transparent gray. For each case, the R, PPS, and one intermediate conformation of loop 4 are shown. The directions of loop torsion are shown by green arrows. The inset indicates the location of L4 in the converter domain.

