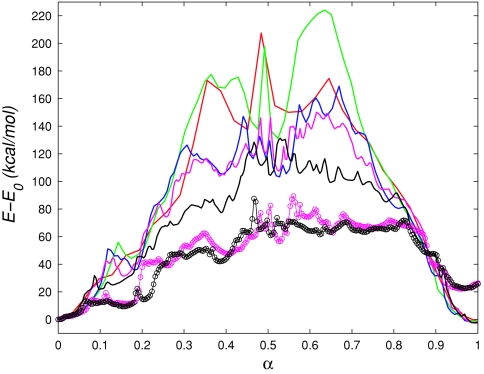
Figure 5.
(a) Potential energy along the initial paths calculated using the zero-temperature string method (ZTS). MEP1: Red solid line iteration 400, 32 replicas; green solid line iteration 500, 64 replicas; blue solid line iteration 600, 128 replicas; magenta solid line iteration 700, 256 replicas; (magenta ○––) iteration 700, 256 replicas; energy from dihedral angles and van der Waals interactions excluded. MEP2: black solid line iteration 700, 256 replicas; (black ○––) iteration 700, 256 replicas; energy from dihedral angles and van der Waals interactions excluded.

