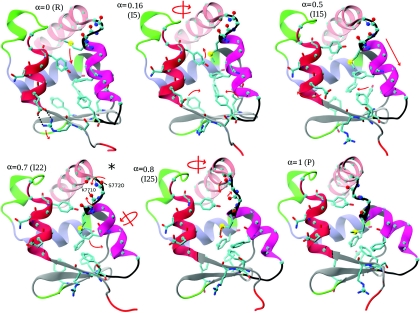
Figure 7.
Snapshots from simulation S3 (Table 4) that illustrate the transition mechanism. The converter structures are shown, as in Fig. 1. Red arrows indicate the conformational change associated with the snapshot. The location of the snapshot on the transition path (α = Ix∕I31), and the corresponding image index (I0–I31) are shown for each snapshot. Images I0 and I31 correspond to the rigor (R) and pre-powerstroke (P) states, respectively. Hydrogen bonds between R708 and E713 are indicated by dotted black lines in the R snapshot. The metastable state is indicated by an asterisk. Residues and secondary structure elements are labeled in Fig. 1.

