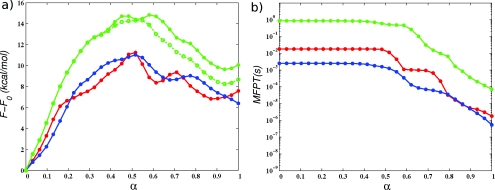
Figure 9.
(a) Free energy of reaction (F). (b) MFPT to the milestone nearest to the PPS state. The symbols are as follows: (red •—), F1; (green •—), F2; (green ○⋅⋅⋅), corrected F2 (only for a); (blue •—), F3; see text and Table 4 for a description of each simulation.

