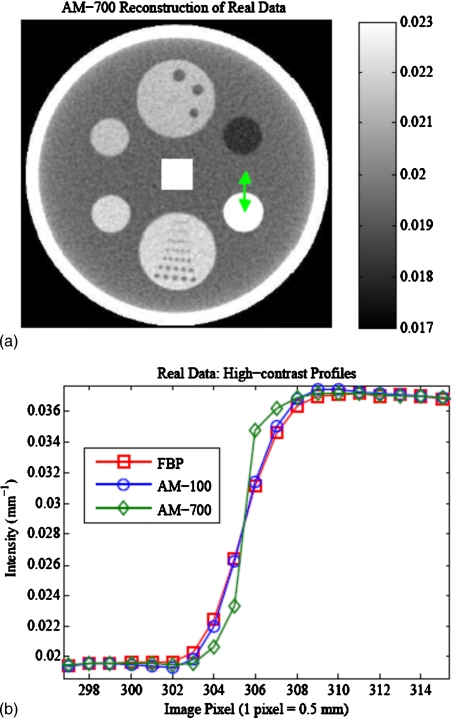
Figure 13.
(a) AM-700 reconstructed image of the multipin layer of a daily QA phantom from real data acquired on a Philips Brilliance Big Bore CT scanner. Smoothing strengths were adjusted to match noise (∼0.94% in the central square ROI) within 0.005% among the AM-700, AM-100, and FBP images. (b) Visible differences in the high-contrast insert (4 o’clock) are illustrated in the profiles.

