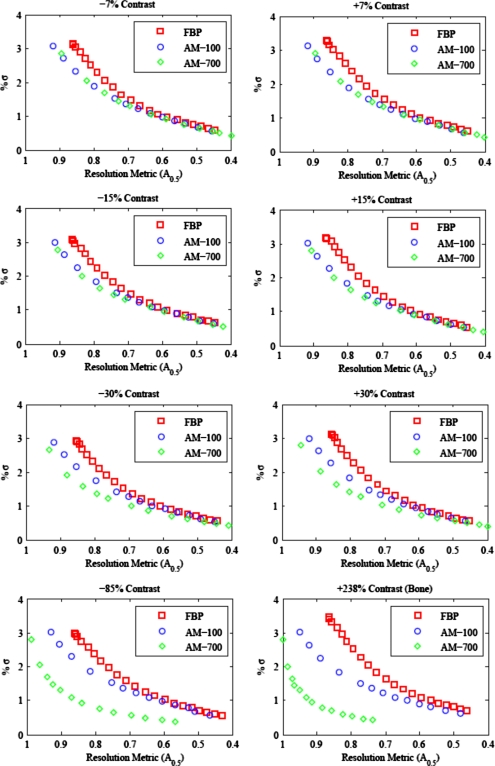
Figure 8.
Noise-resolution tradeoff curves for the clock phantom reconstructed with 100k projection noise. Note the reverse x-axis. As the smoothing strength is increased, noise is reduced at the cost of reduced resolution. The tradeoff curve for AM with δ=700 for the penalty function is markedly different for structures of varying contrast.

