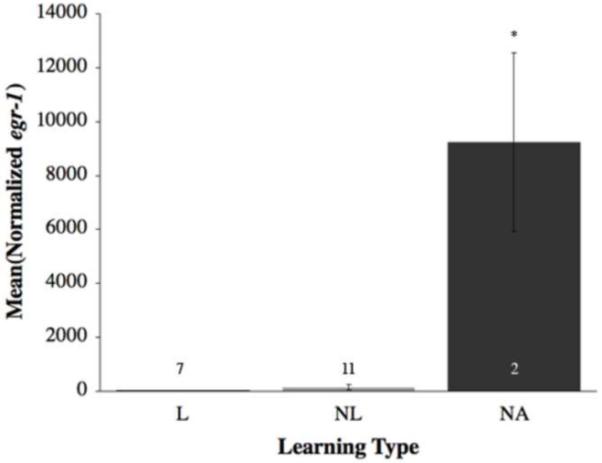
Figure 6.

Mean (±SE) relative gene expression of egr-1 within the dorsomedial telencephalon (Dm) by learning type. Open bars represent learners (L); grey bars represent non-learners (NL); black bars represent non-attempting fish (NA). Numbers within or immediately above the bars are sample size. Asterisks signal a significant difference (p < 0.05). NA fish demonstrated significantly higher levels of egr-1 than both L and NL in the Dm.
