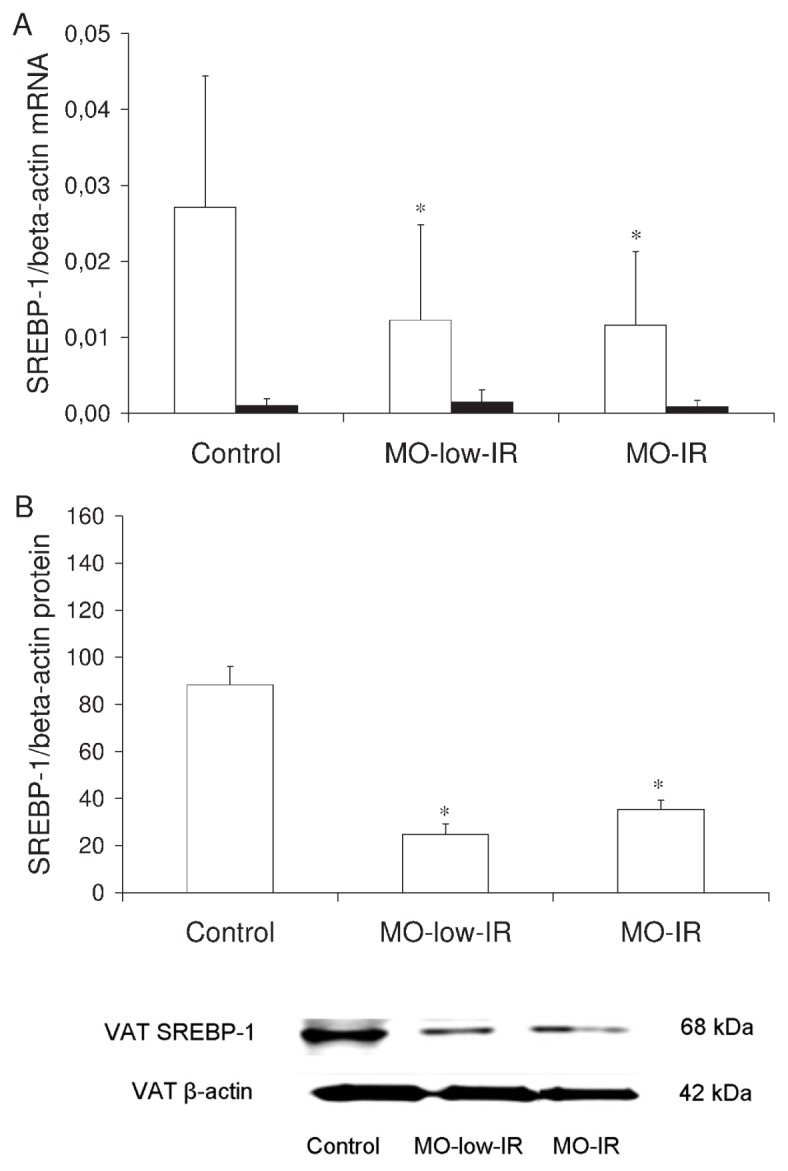
Figure 3.

SREBP-1 in adipose tissue. (A) SREBP-1/β-actin mRNA expression levels in VAT and SAT from controls and morbidly obese patients. (B) SREBP-1/β-actin protein levels in VAT and SAT from controls and morbidly obese patients (n = 8 per group). White column, VAT; black column, SAT. The results are given as the mean ± SD. Comparison between the results of the 3 groups was made with one-way ANOVA. *Significant differences with the control group (P < 0.05).
