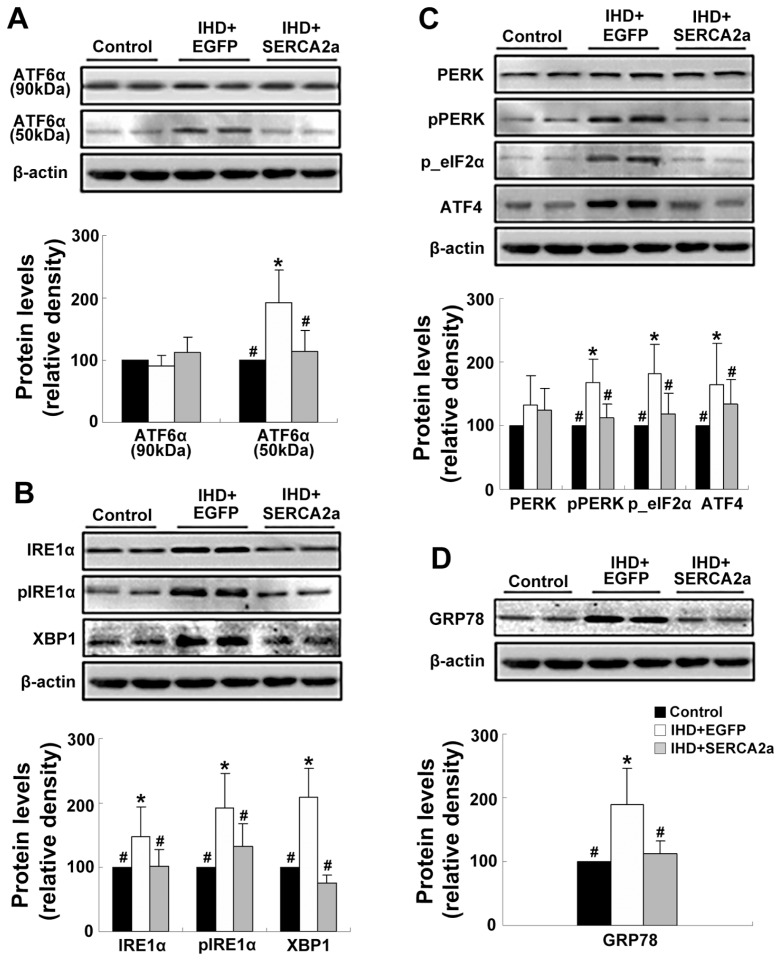
Figure 5.
Restoration of SERCA2a protein expression reverses the activation of UPR signaling pathways. (A) The protein levels of the ATF6α branch of UPR: ATF6α (90 kDa) and ATF6α (50 kDa). (B) The protein levels of the IRE1α branch of UPR: IRE1α, phospho-IRE1α and XBP-1. (C) The protein levels of the PERK branch of UPR: PERK, phospho-PERK, phospho-eIF2α and ATF4. (D) The protein levels of GRP78. Data are presented as mean ± SEM (n = 4~6 per group). *P < 0.05 versus control group; #P < 0.05 versus IHD+EGFP group.

