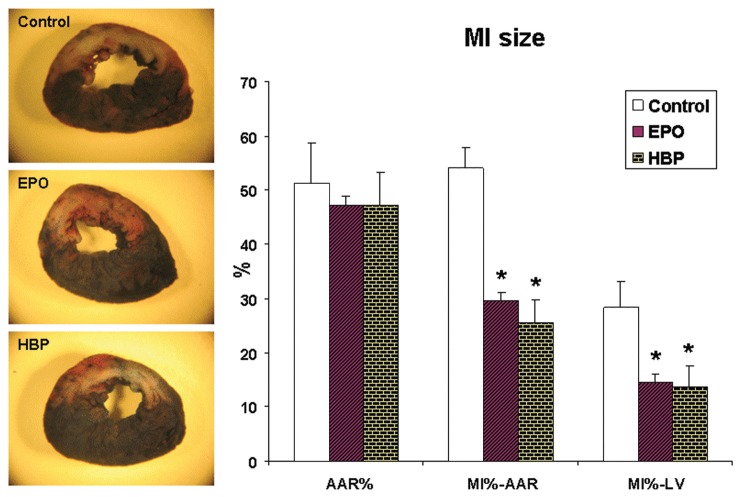
Figure 2.
Effect of pHBP on MI size 24 h after its induction. Left, photographs of representative examples of untreated heart and hearts treated with rhEPO and pHBP after incubation in TTC. Right, average MI size expressed as % of area at risk (AAR) or LV. The number of animals per group: Control, n = 8; rhEPO, n = 8; HBP, n = 9. *P < 0.05 versus control (Bonferroni correction).

