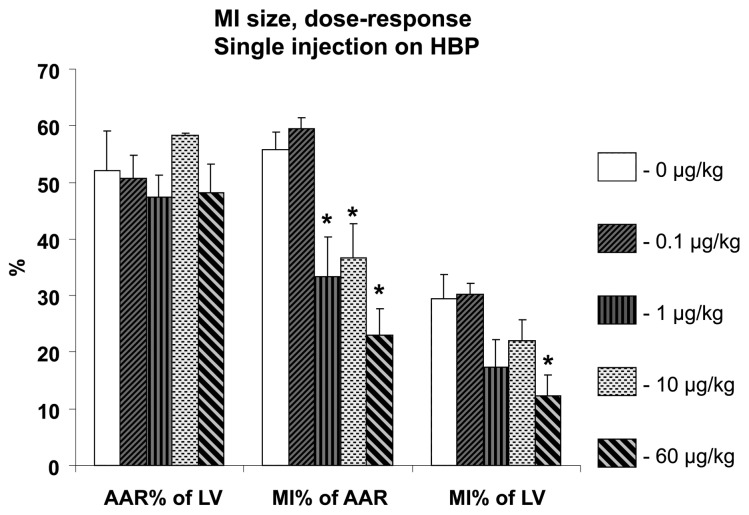
Figure 6.
MI size expressed as percent of AAR or LV 24 h after coronary ligation followed by different doses of pHBP treatment. The number of animals per group: Control, n = 13; pHBP 60 μg/kg, n = 11; pHBP 10 μg/kg, n = 5; pHBP 1 μg/kg, n = 8; pHBP 0.1 μg/kg, n = 5. *P < 0.05 versus control (Bonferroni correction).

