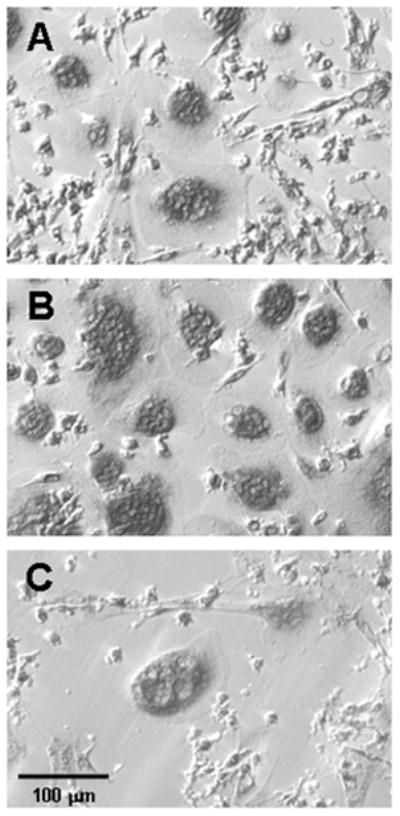
Figure 2.

Photomicrograph of representative cultures of cells from a Control subject after staining for TRAP activity. Bone marrow cells were cultured for 2 weeks in (A) basal medium, (B) basal medium with 25 ng/ml M-CSF, and (C) basal medium with 10−7 M alendronate. Hoffman modulation contrast optics accentuate nuclear profiles and margins of the cells.
