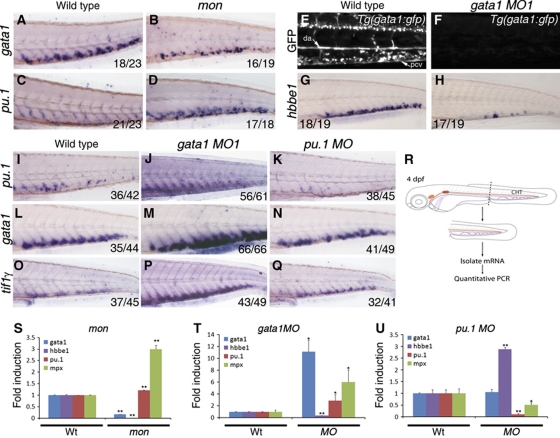
Figure 4.
Tif1γ differentially regulates expression of gata1 and pu.1 in the CHT. Epistatic analysis of tif1γ, gata1 and pu.1 function in the CHT at 4 dpf. mon mutants were used to analyse tif1γ loss of function; gata1 MO1 (30 ng/nl) and pu.1 MO (30 ng/nl) were used to analyse gata1 and pu.1 loss of function, respectively. (A) At 4 dpf, gata1 is expressed in the CHT of wild-type embryos and (B) severely reduced in mon larvae. (C) pu.1 is expressed at low levels in the wild-type CHT, whereas (D) it is massively increased in the CHT of mon mutants. (E) Expression of the GFP transgene in Tg(gata1:gfp) larvae. Abundant GFP-expressing cells are found in circulation and in the CHT region between the dorsal aorta (DA) and the posterior cardinal vein (PCV). (F) gata1 MO1 injection induced a complete loss of GFP expression. (G) Expression of hbbe1 in wild-type larvae. (H) hbbe1 expression was significantly downregulated in gata1 morphants. (I) Expression of pu.1 in wild-type larvae. (J) gata1 morphants show increased pu.1 expression in the CHT, whereas (K) pu.1 morphants show little pu.1 expression. (L) Expression of gata1 in wild-type embryos. (M) gata1 morphants show increased gata1 expression, whereas (N) pu.1 morphants show no obvious change in gata1 expression in the CHT. (O) Expression of tif1γ in wild-type larvae. (P) tif1γ expression is upregulated in gata1 morphants. (Q) pu.1 MO knockdown does not appear to affect tif1γ expression in the CHT. All CHTs are shown as lateral views, anterior to the left. (R) Schematic representation of tail microdissection (containing the CHT) for mRNA isolation and quantitative PCR analysis. (S) Analysis of gata1, hbbe1, pu.1 and mpx expression in wild-type or mon mutants at 4 dpf. (T) Analysis of gata1, hbbe1, pu.1 and mpx expression in wild-type or gata1 morphants and (U) pu.1 morphants at 4 dpf. (A–Q) The number of embryos analysed are shown in each panel. (S–U) Expression of each gene in dissected wild-type tails was set to 1 for comparison. All data are shown as average±s.d. values; **P<0.0001; *P<0.007. See also Supplementary Figure S5.

