Figure 1.
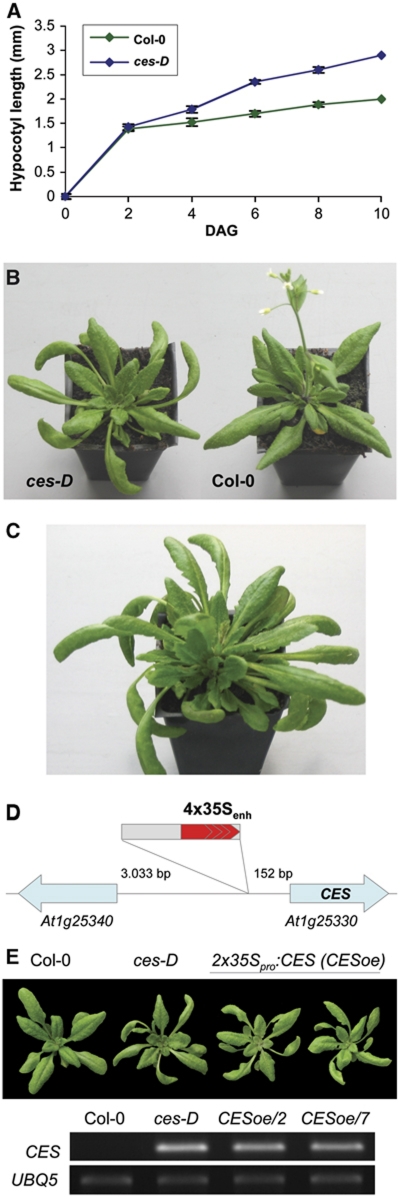
Phenotypic and molecular characterization of the ces-D mutant. (A) Hypocotyl length of light-grown wild-type Col-0 (green) and ces-D (blue) seedlings at different time points after germination. Data points are the average of three independent experiments. The standard error is shown. (B) Representative ces-D (left) and wild-type Col-0 (right) plants 30 DAG grown in long-day conditions. (C) Representative adult ces-D plant, grown in the same conditions as in (B), at 42 DAG. (D) Schematic representation of the ces-D mutation. (E) Recapitulation of the ces-D phenotypes. (Top) 4-week-old plants grown in the same conditions as in (B). (From left) Wild type, ces-D and two independent homozygous lines transformed with a 2x35Sp:CES construct. (Bottom) Semi-quantitative RT–PCR analysis of CES expression in 10-day-old seedlings of the plant lines shown. UBQ5 served as an internal control.

