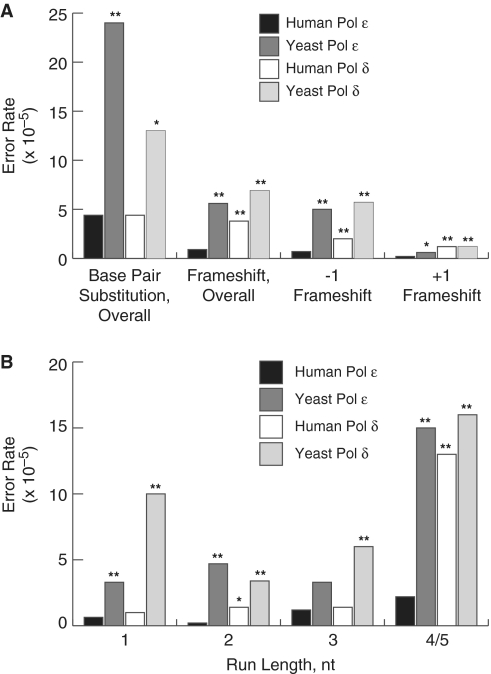
Figure 2.
Base substitution and frameshift error rates for human and yeast Pol ε and human and yeast Pol δ. (A) Error rates for base pair substitutions, overall frameshifts, −1 and +1 frameshifts. Error rates were calculated as described (54). Error rates are shown for human Pol ε (black bars, this study), yeast Pol ε [dark gray bars, (59)], human Pol δ [white bars, (58)] and yeast Pol δ [light gray bars, (57)]. P-values are shown above each comparison to a human Pol ε error rate where the difference was found to be significant. The (asterisk and double asterisk) symbols indicate P-values where P ≤ 0.05 and 0.001, respectively. (B) Single nucleotide deletion dependence on homonucleotide run length. Error rates were calculated for −1 deletions in non-iterated nucleotides (1) or runs of the indicated number nucleotides (2, 3, 4/5). The legend and source of data are as in (A).

