Figure 3.
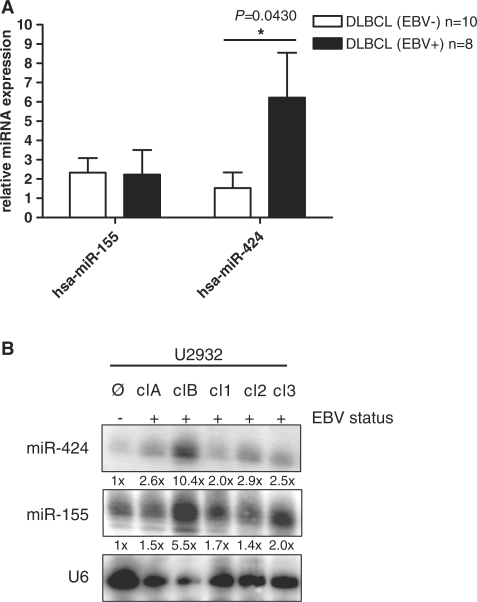
miR-155 and -424 expression validation in primary DLBCL and DLBCL cell lines. (A) MiR-155 and miR-424 expression validation by quantitative RT–PCR. Total RNA was extracted from three tonsil tissues, and each 10 EBV positive and eight negative DLBCL (including tissues previously used for small RNA-library generation), were used for qRT-PCR analysis. Bars indicate relative expression levels compared to normal control. *P-vlaue < 0.05, student’s t-test, paired. (B) miR-155 and -424 expression validation by northern blot in DLBCL cell lines. Total RNA of U2932 cell line and EBV-positive clones (A, B, 1, 2 and 3) was detected using miRNA-specific probes and quantified by densitometric analysis. Given numbers display relative expression levels compared to loading control U6 snRNA.

