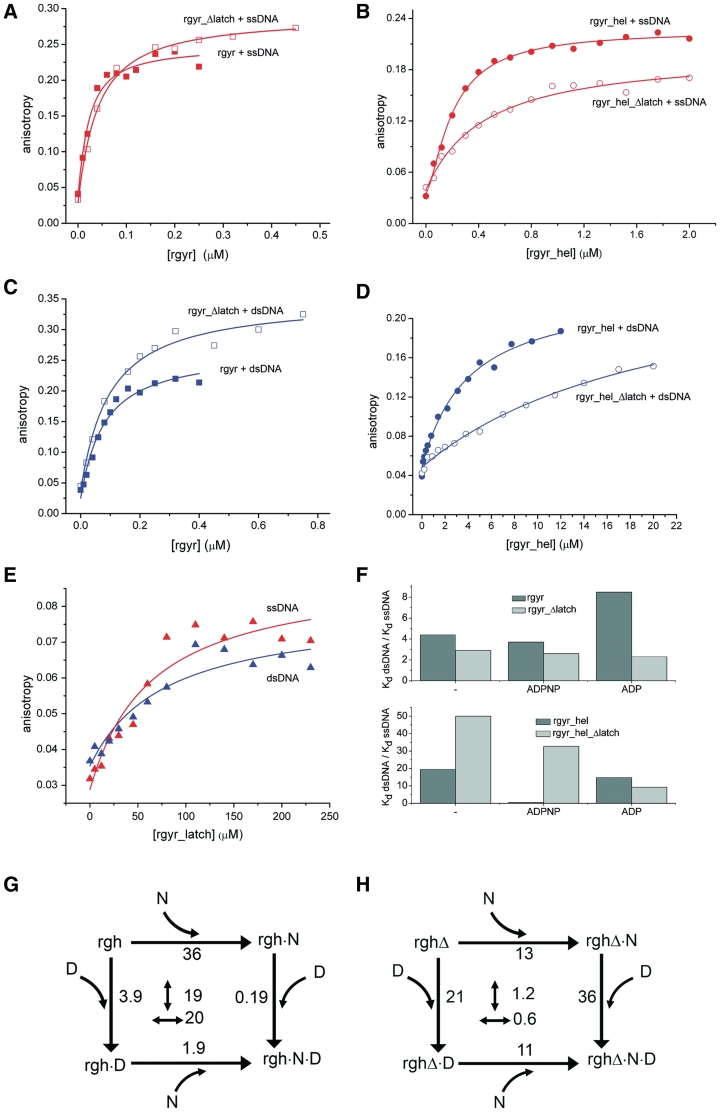
Figure 4.
DNA binding. (A) Titration of 10 nM ssDNA with rgyr (filled squares) and rgyr_Δlatch (open squares). (B) Titration of 25 nM ssDNA with rgyr_hel (filled circles) and rgyr_hel_Δlatch (open circles). (C) Titration of 10 nM dsDNA with rgyr (filled squares) and rgyr_Δlatch (open squares). (D) Titration of 25 nM dsDNA with rgyr_hel (filled circles) and rgyr_hel_Δlatch (open circles). (E) Titration of 25 nM ssDNA (red) or dsDNA (blue) with the isolated latch domain. Binding curves for ssDNA are shown in red, binding curves for dsDNA are depicted in blue. For Kd values from the depicted data and Kd values in different nucleotide states, see Table 3. (F) Preference for ssDNA in rgyr and rgyr_Δlatch (upper panel) and rgyr_hel and rgyr_hel_Δlatch (lower panel) in different nucleotide states. (G) Thermodynamic cycle for ADPNP (N) and dsDNA (D) binding to rgyr_hel (rgh). The Kd values in µM are indicated. Numbers in the center refer to the coupling factor (n-fold decrease in Kd when the first ligand is already bound). The coupling factor for binding of ADPNP and dsDNA to rgyr_hel is ∼20. (H) Thermodynamic cycle for ADPNP (N) and dsDNA (D) binding to rgyr_hel_Δlatch (rghΔ). The coupling factor for ADPNP and dsDNA binding is ∼1, indicating that coupling is lost upon latch deletion.

