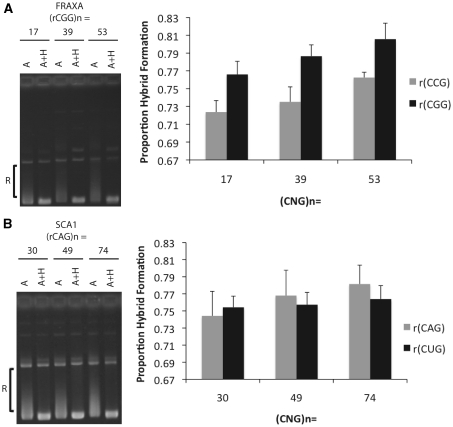
Figure 4.
Quantification of relative RNA–DNA hybrid formation at increasing repeat lengths. (A) In vitro transcription reactions were performed on FRAXA plasmids bearing repeat tracts of (CGG)17 · (CCG)17, (CGG)39 · (CCG)39 and (CGG)53 · (CCG)53 following which samples were treated with RNase A or A+H. Hybrid formation was quantified by densitometry analysis using image quant by measuring the proportion of products that migrate between open circular and supercoiled position (indicated by ‘R’) divided by the total products below open circular including supercoiled. RNase A+H treated samples were used to determine the position of the supercoiled DNA for each repeat length. To the left of the graph is a representative gel used to quantify relative hybrid formation. The RNA indicated in the graph represents the RNA component bound in the RNA:DNA hybrid. Error bars are derived from three separate experiments (N=3). Using the t-test to compare R-loop formation revealed a significant difference between the 17 and 53 rCGG R-loop (P=0.0413) as well as the 17 and 53 rCCG R-loop (P=0.0092). (B) The same analysis was performed as in (A) but for SCA1 plasmids bearing repeat tracts of (CAG)30 · (CTG)30, (CAG) 49 · (CTG)49 and (CAG)74 · (CTG)74. Using the t-test to compare R-loop formation between each of the (CAG) · (CTG) repeat lengths did not reveal any statistically significant differences.

