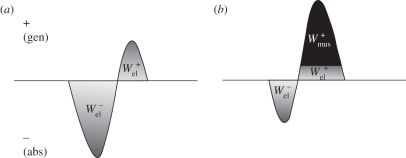
Figure 2.
A graphical representation of the calculation of the negative and positive elastic work and the positive muscle fibre work estimated at the joints during running. The power traces represent scenarios where either (a) all of the positive joint work (area under joint power curve) is provided by the recoil of stored elastic strain energy or (b) where only a fraction of the positive joint work is provided passively by the recoil of stored elastic strain energy with the remainder attributed to muscle fibres.

