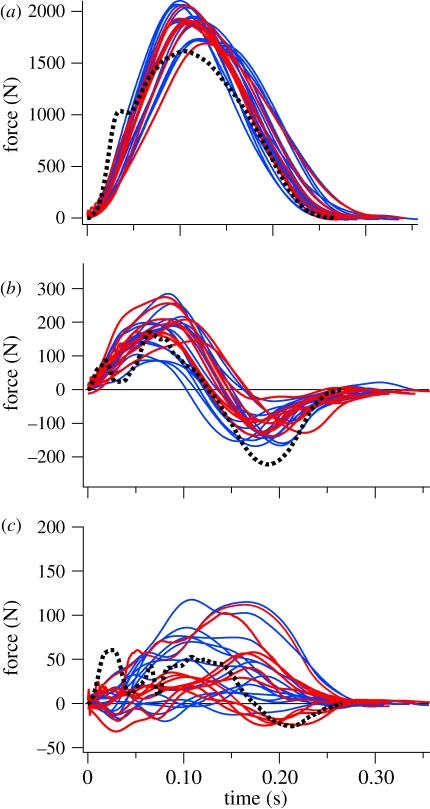
Figure 3.
Ground reaction force profiles for ostriches (solid lines) and a typical human trace (dotted line): (a) vertical, (b) fore–aft, and (c) medio-lateral directions. Red traces represent ostrich data from those trials used for full three-dimensional joint mechanical analyses (five traces per animal), and blue traces represent data from an additional three animals from which ground reaction forces were collected (five traces per animal).

