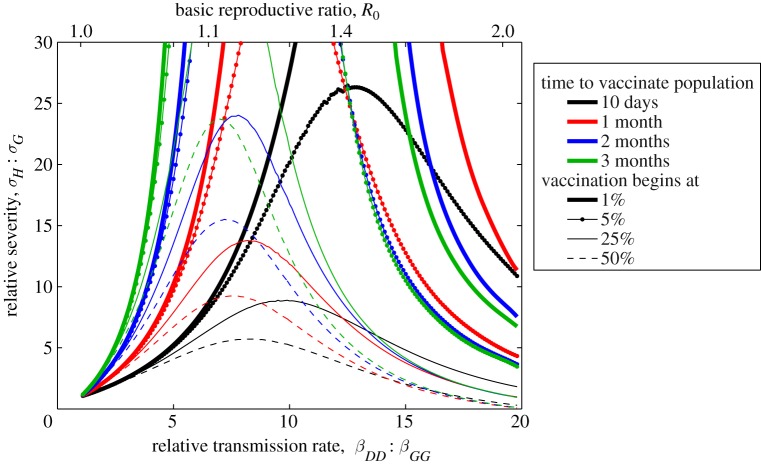
Figure 2.
Epidemiological trade-off between initially vaccinating the group of dominant transmitters compared with initial vaccination of the group most likely to suffer severe consequences of infection. The curves are the contours where the two targeting strategies are equal (have the same total consequences integrated over the epidemic and summed over the groups); parameters above the curve favour vaccination of the severe-risk group first. The different coloured lines correspond to different speeds of vaccination (taking 10 days, 1, 2 or 3 months to vaccinate the entire population); the different line styles correspond to different points at which the vaccination campaign could begin (when the total number of cases have reached 1, 5, 25 or 50% of the unvaccinated total). (Throughout, we set all the transmission rates equal to γ except βDD > γ; 1/γ = 4 days.)

