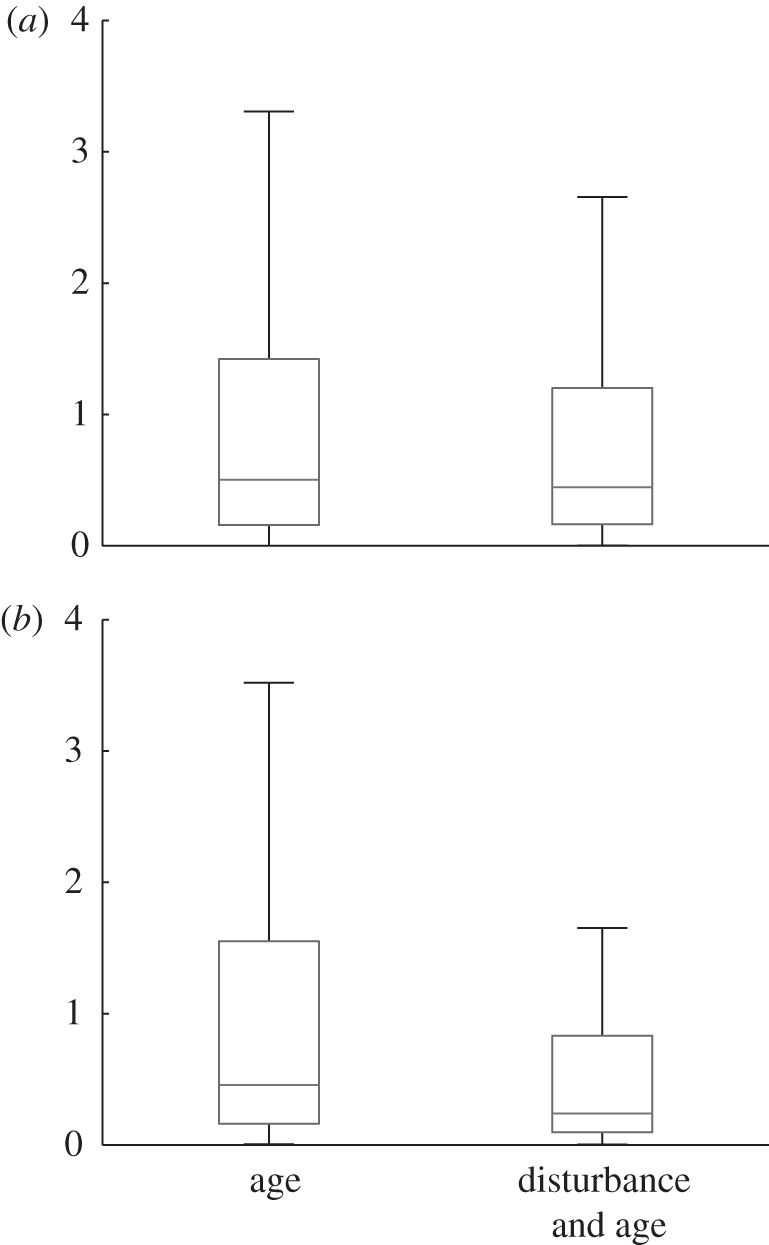
Figure 6.

Boxplots of absolute errors by the two prediction models with respect to the input variables used. Each box has three lines at the lower quartile, median and upper quartile values, with the extended lines showing the range of the rest of the data. (a) Linear regression, (b) GP.
