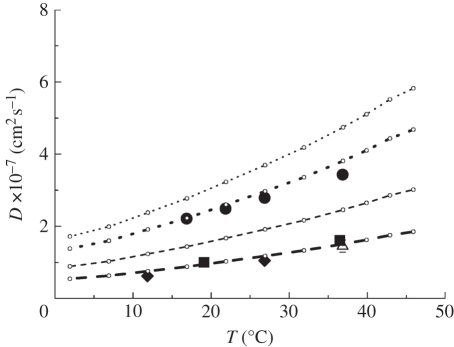
Figure 3.
Diffusion coefficient D of Hb in RBCs as a function of temperature. The diffusion coefficients were measured with QENS on IRIS (circles), on IN16 (diamonds), on IN10 (squares) and with neutron spin-echo spectroscopy on IN15 (triangle) [14]. D0 was measured with dynamic light scattering and scaled data points are given as small empty circles. The thin dotted and the thin dashed line show the theoretical values of short-time  and long-time self-diffusion
  of Hb at a volume fraction of ϕ = 0.25 with hydrodynamic interactions (
 ) [47]. The thick dotted and the thick dashed line represent the theoretical values for short-time and long-time self-diffusion of Hb assuming that a hydration layer of 0.23 gram H2O per gram protein is bound to the surface of Hb. Experimental data agree well with the theoretical considerations when the bound hydration water layer is taken into account (
 ) [47].

