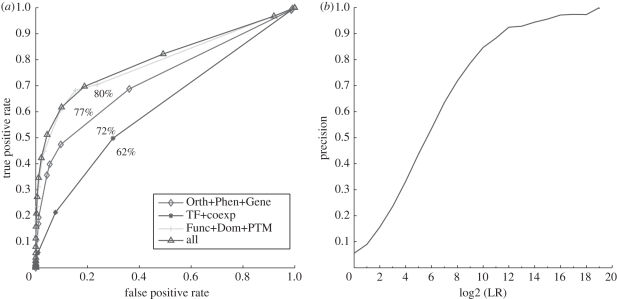
Figure 1.
Prediction performance. (a) ROC curve of different methods for PPI prediction. ‘Orth + Phen + Gene’ represents the combination of orthologue mapping of physical protein interactions from model organisms (Orth), phenotype similarity (Phen) and Genetics interaction (Gene); ‘TF + Coexp’ represents the combination of regulation of common transcriptional factors (TF) and meta-analysis of coexpression (Coexp); ‘Func + Dom + PTM’ represents the combination of shared biological functional annotation (Func), Interaction of domains (Dom), Co-occurrence of post translational modification pair (PTM); ‘All’ represents the integration of all methods. (b) log2 (LR) cutoffs versus precision of PPI prediction.

