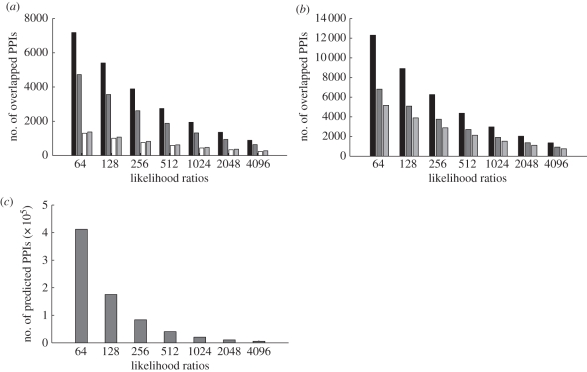
Figure 2.
Overlap of PPIs in different databases and predicted PPIs. (a) Overlaps of predicted PPIs derived from different LR cutoffs and human PPI databases (HPRD, black bar; BioGRID, dark grey bar; MINT, white bar and IntAct, light grey bar). (b) Overlaps of Predicted PPIs derived from different LR cutoffs and Predicted PPIs with different posterior odds cutoffs in PIPs database; black bar, PIPLR100, dark grey bar, PIPLR400 and light grey bar, PIPLR1000 represent the PPIs datasets derived from the posterior odds cutoffs of 0.25, 1 and 2.5 separately. (c) The number of predicted PPIs under the condition of increasing LR cutoffs.

