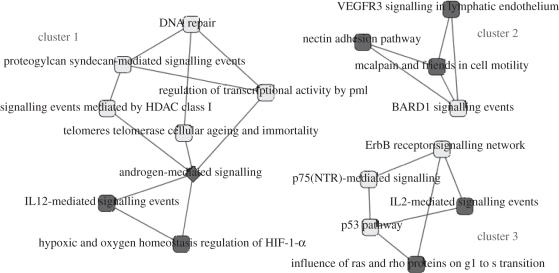
Figure 3.
Top three clusters of over-represented subnetwork of mixPCN enriched for interactions between mutated genes in brain cancer. The light grey nodes represent pathways which ranked in top 50 crosstalk in over-represented subnetworks by either number of mutated gene pairs or p-value ranking methods; the triangle nodes indicate pathways which did not rank in top 50 crosstalk in over-represented subnetworks by two ranking methods; squares represent pathways which have been demonstrated to participate in brain cancers through interacting with other pathways in the same cluster in more than one publication; diamonds suggest that more than one interaction with this pathway in this cluster can be verified, but no direct evidence for their roles in brain cancer.

